3/20/2026
Highbar Analytics Dashboards Are Live
Real-time analytics for your event app, live the moment you publish. Here's what's in the first release.

Your event app should tell you what's working and what isn't. That's table stakes. So we built it.
Highbar's analytics dashboards are now live for every published event. They go active the moment your app is available to attendees, and data starts flowing in real time as people engage. No configuration, no waiting, no third-party integrations to wire up.
Here's what's in the first release (2 minute demo 👇)
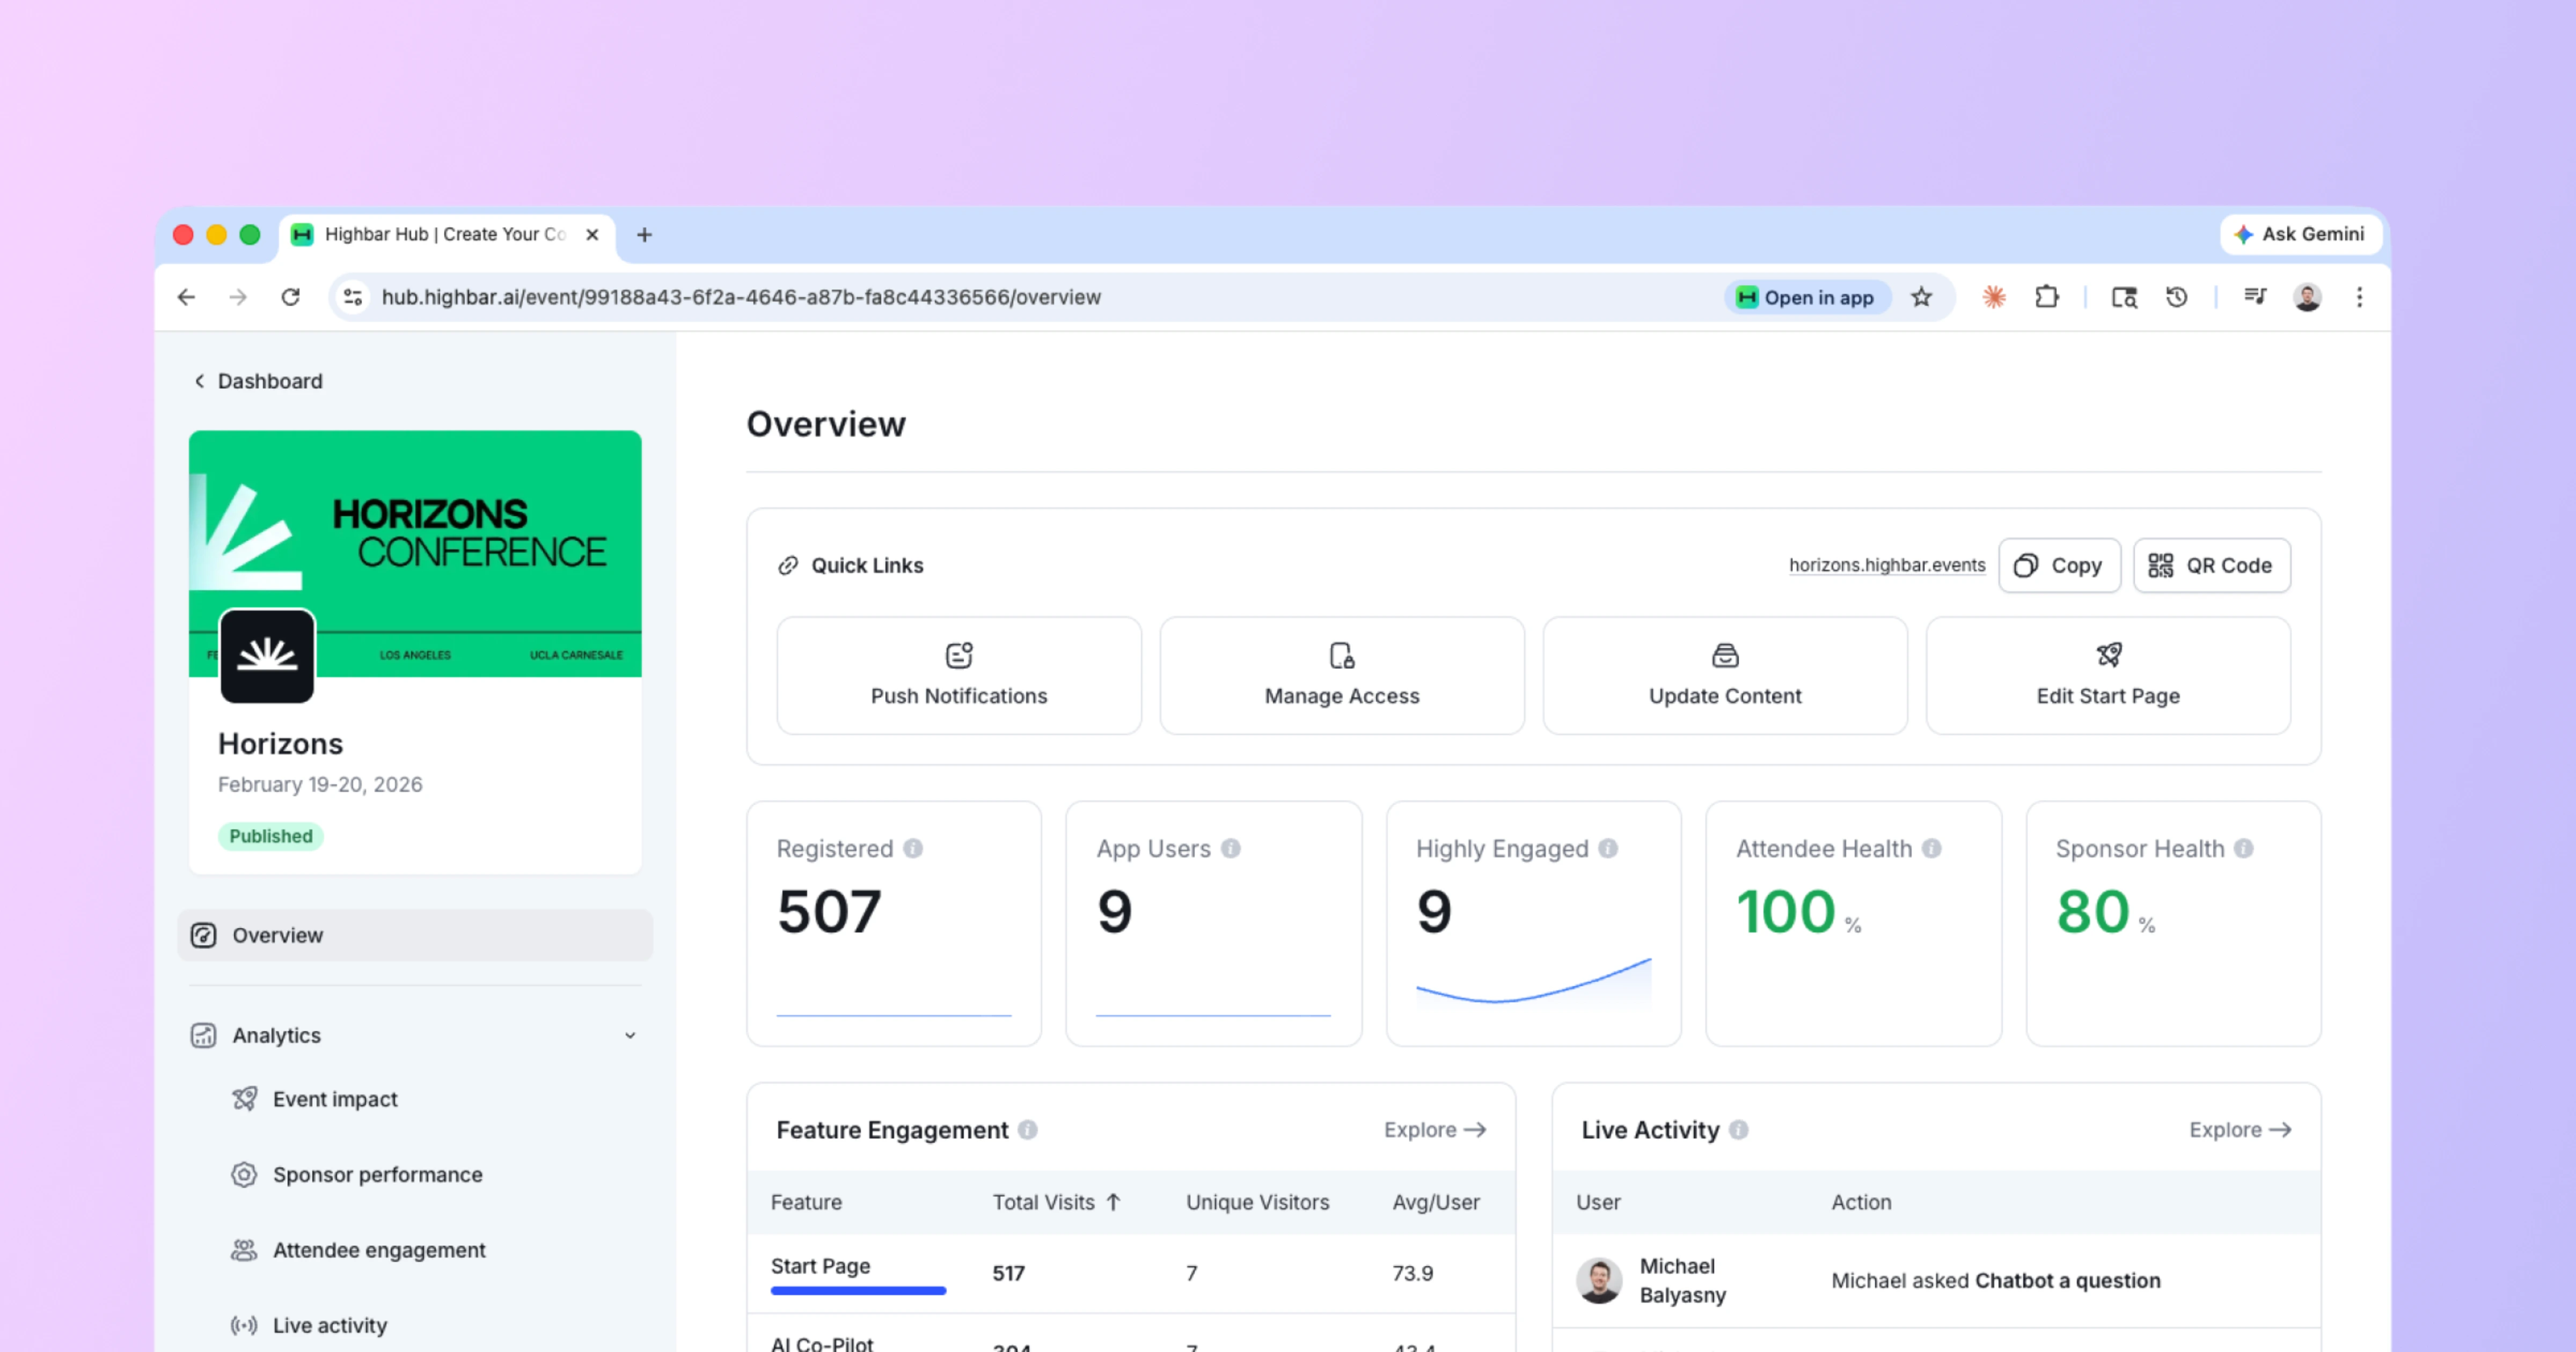
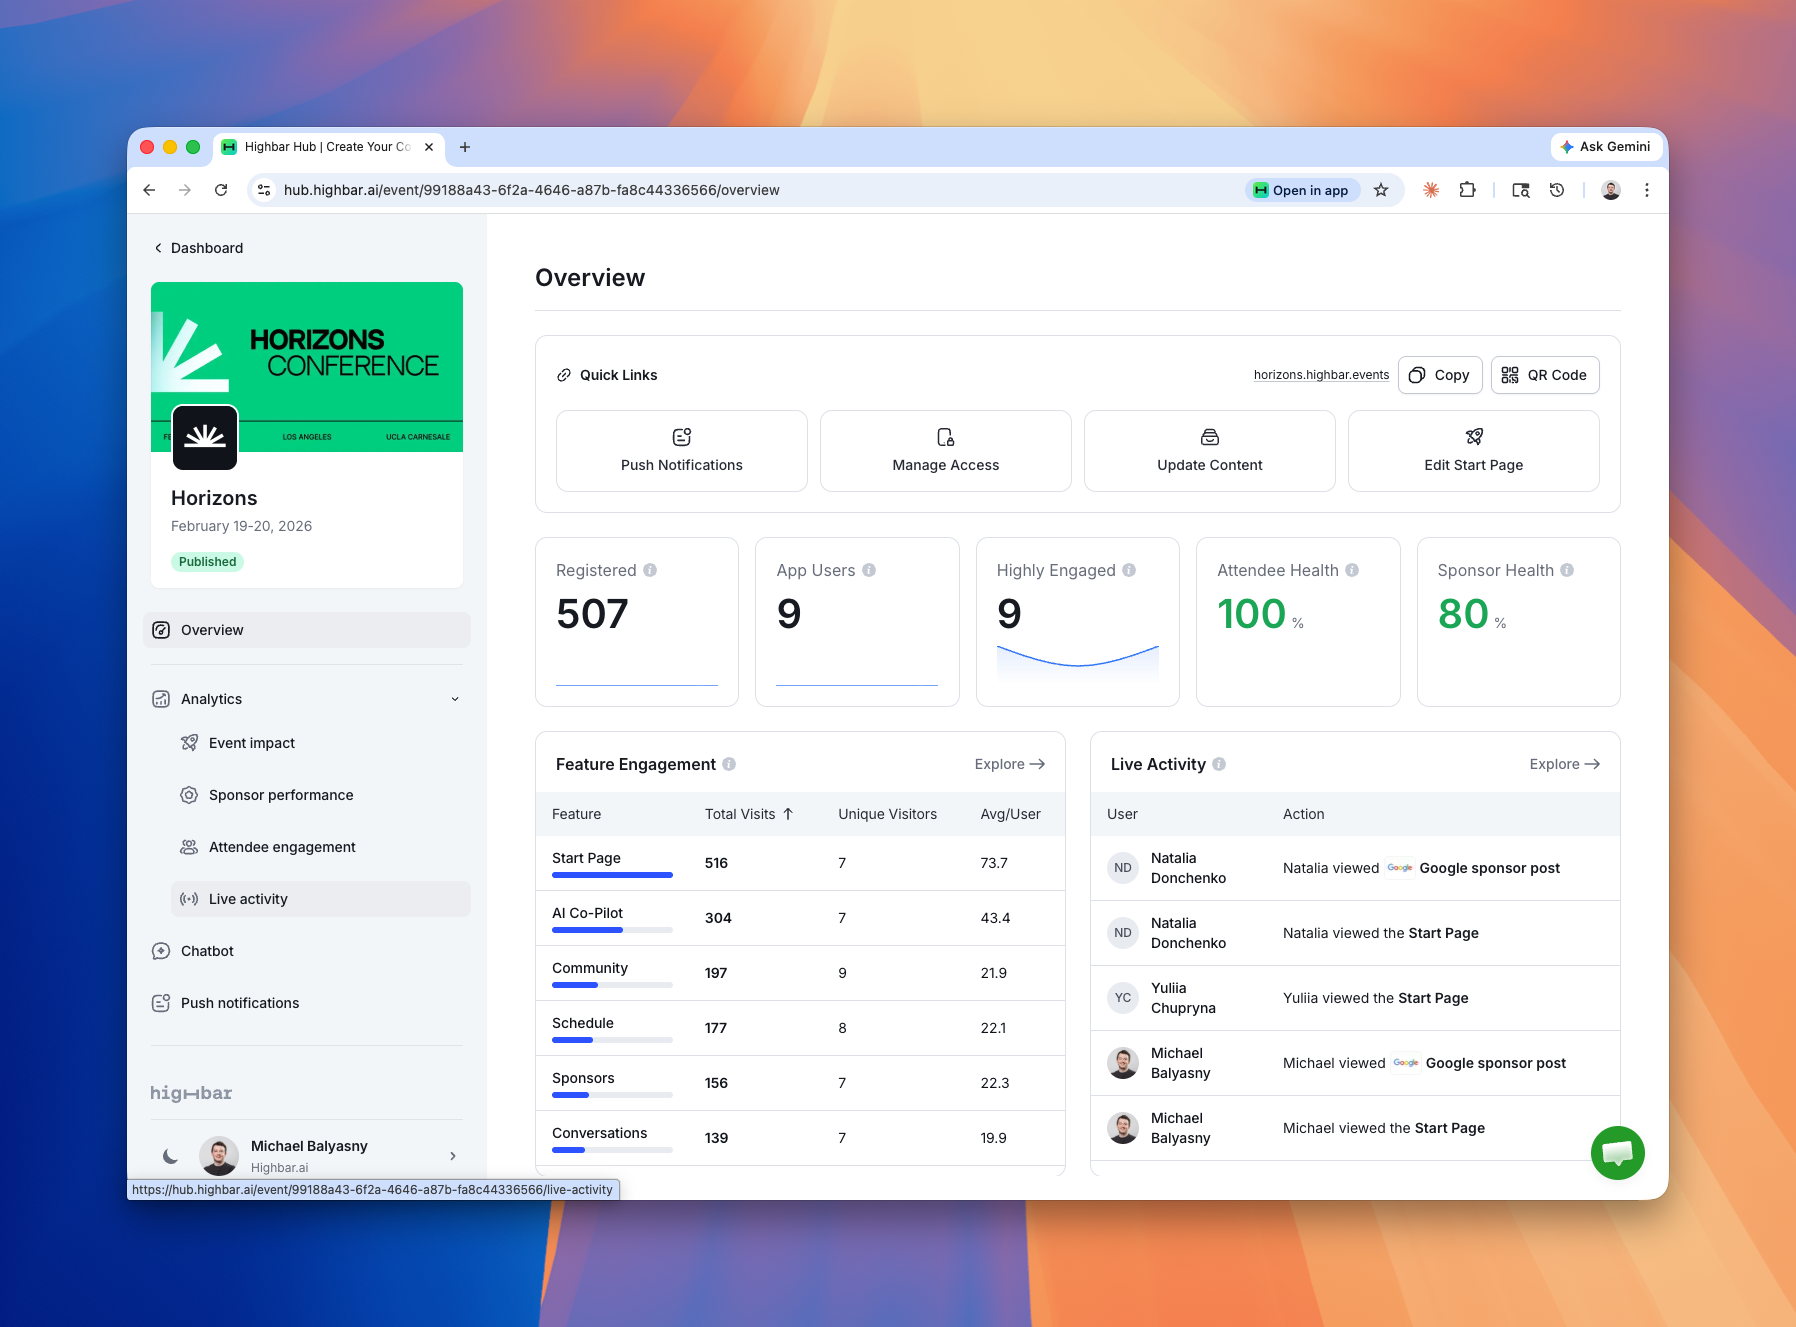
Overview Dashboard
The landing screen gives you a snapshot of everything happening at your event: feature engagement, live activity, chatbot usage, and sponsor performance, all in one place. From here you can click into any report for more detail.
Attendee Journey Funnel
This is part of the Event Impact Report. It maps the full attendee journey from login to profile completion to active engagement. If there's a drop-off somewhere, like people struggling to log in or not completing their profiles, you'll see it immediately and can address it.

Feature-Level Engagement
See where attendees are spending their time. Every session, every speaker, every sponsor is tracked with unique visitors, total visits, and engagement mapped across a timeline. You can filter down to specific features, specific actions, and see exactly who did what and when.

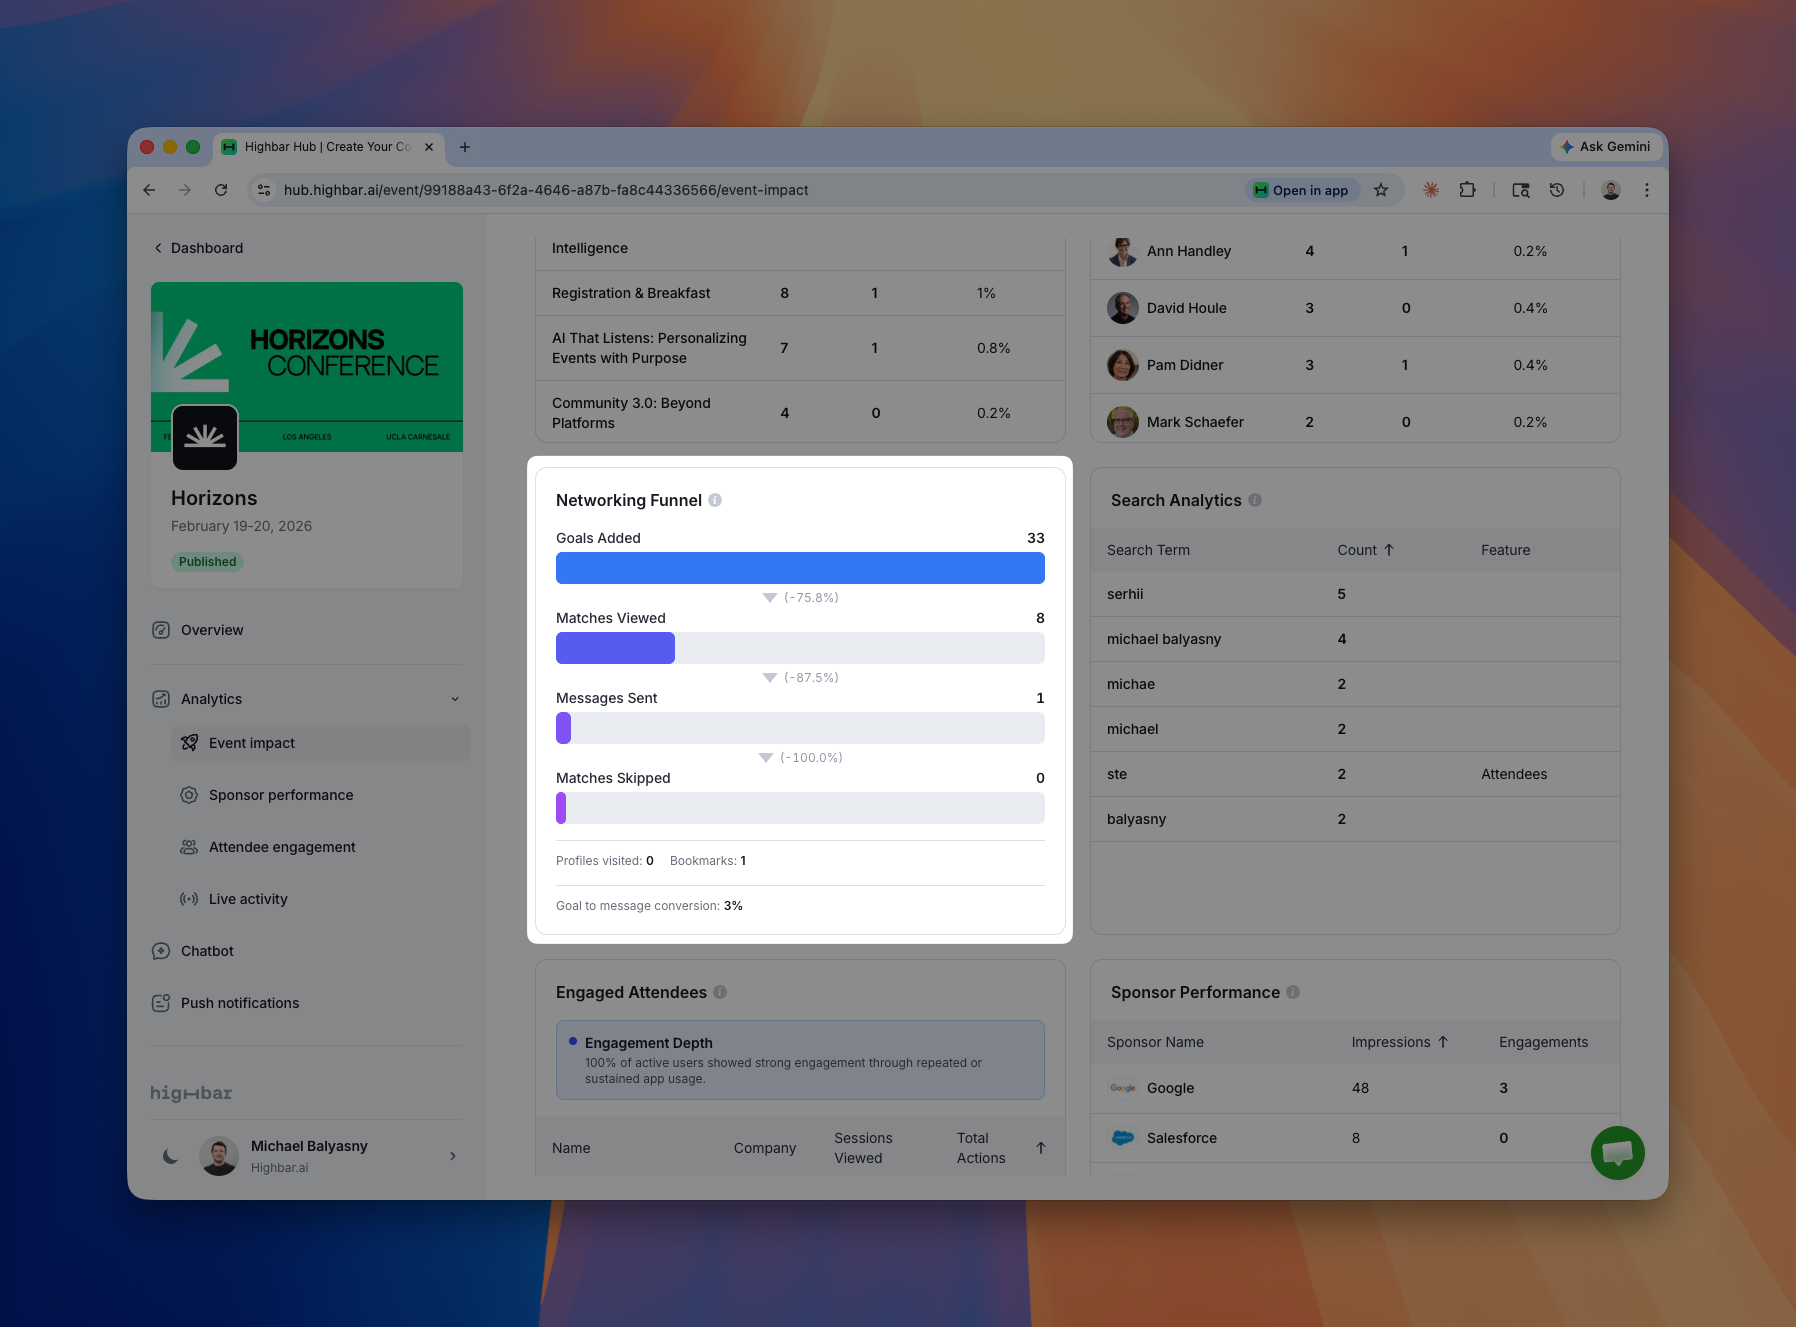
Networking Agent Funnel
If you're using Highbar's Networking Agent, you get a dedicated funnel: how many attendees set networking goals, how many viewed their AI-generated matches, and how many actually sent messages. This tells you whether the networking feature is doing its job or just sitting there.
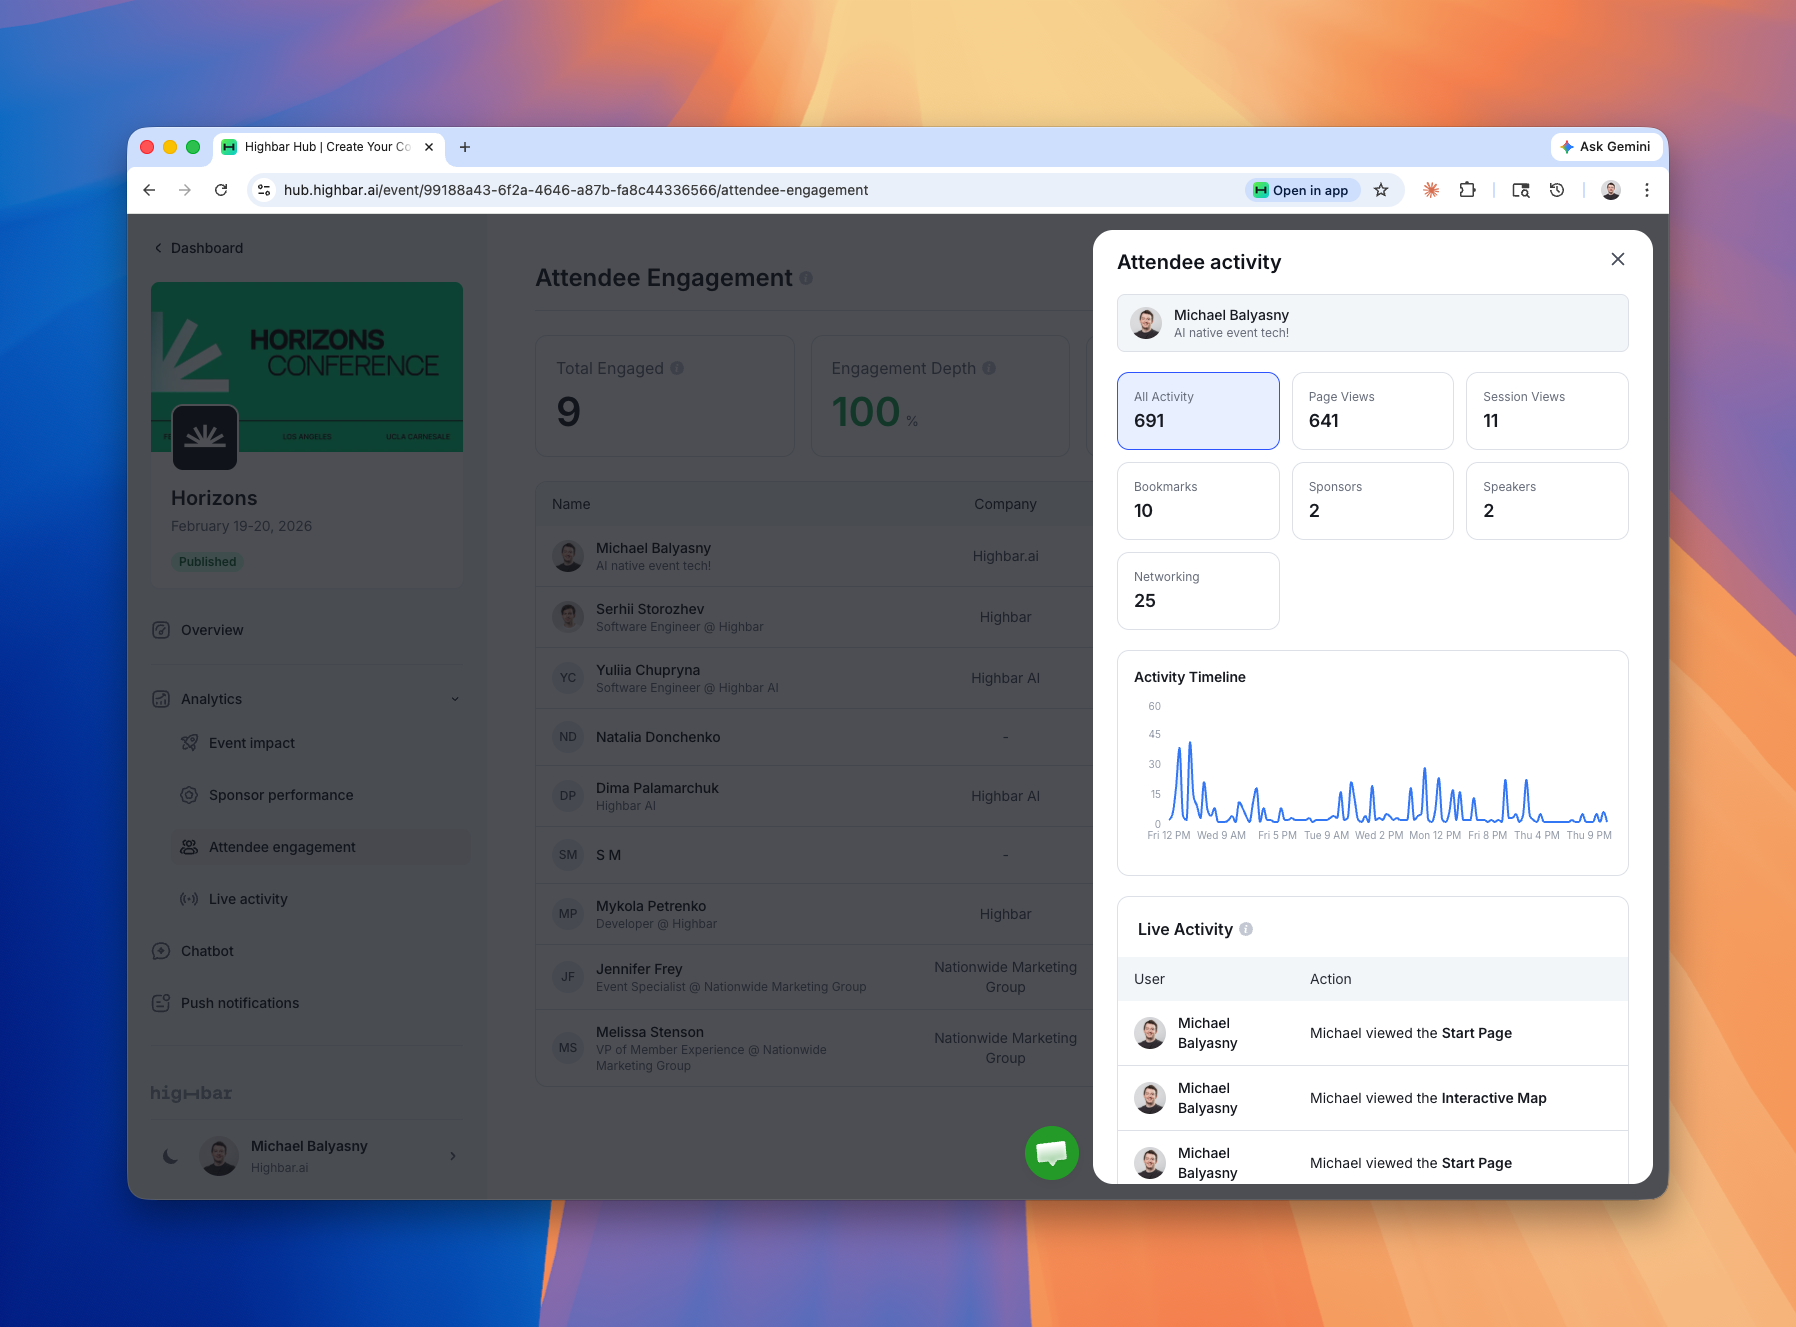
Per-Attendee Activity
See the entire journey for any individual attendee. What they engaged with, when, and how deeply. Useful for sponsor follow-ups, post-event reporting, or just understanding how different audience segments behave.
Sponsor Performance
Dedicated reporting for sponsors with individualized views. This is the data your sponsors are going to ask for anyway, so now it's ready before they do.

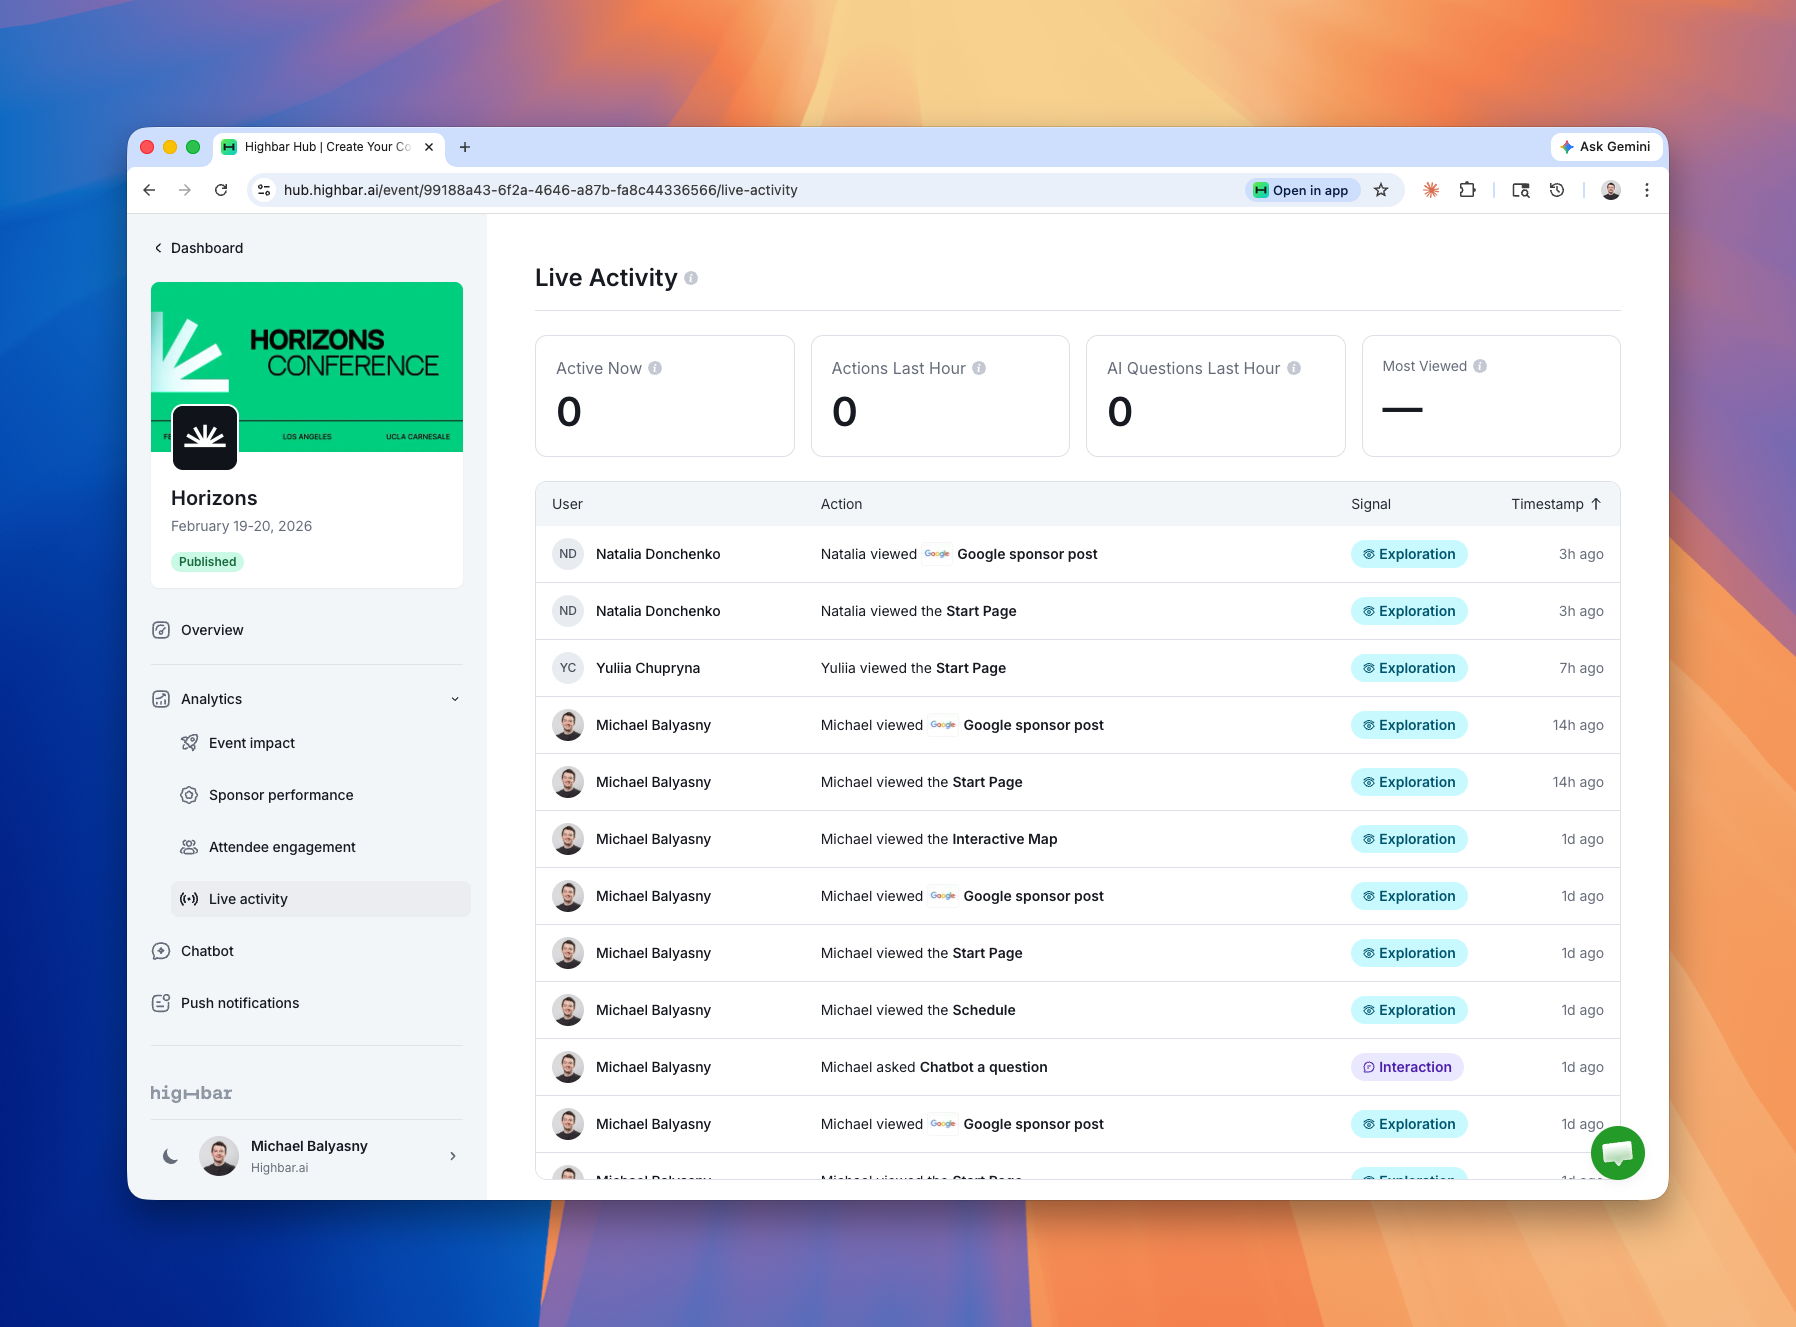
Live Activity Feed
A real-time heartbeat for your event. During the live event, this updates every few seconds showing exactly what attendees are doing right now. Think of it as a pulse check you can glance at throughout the day.
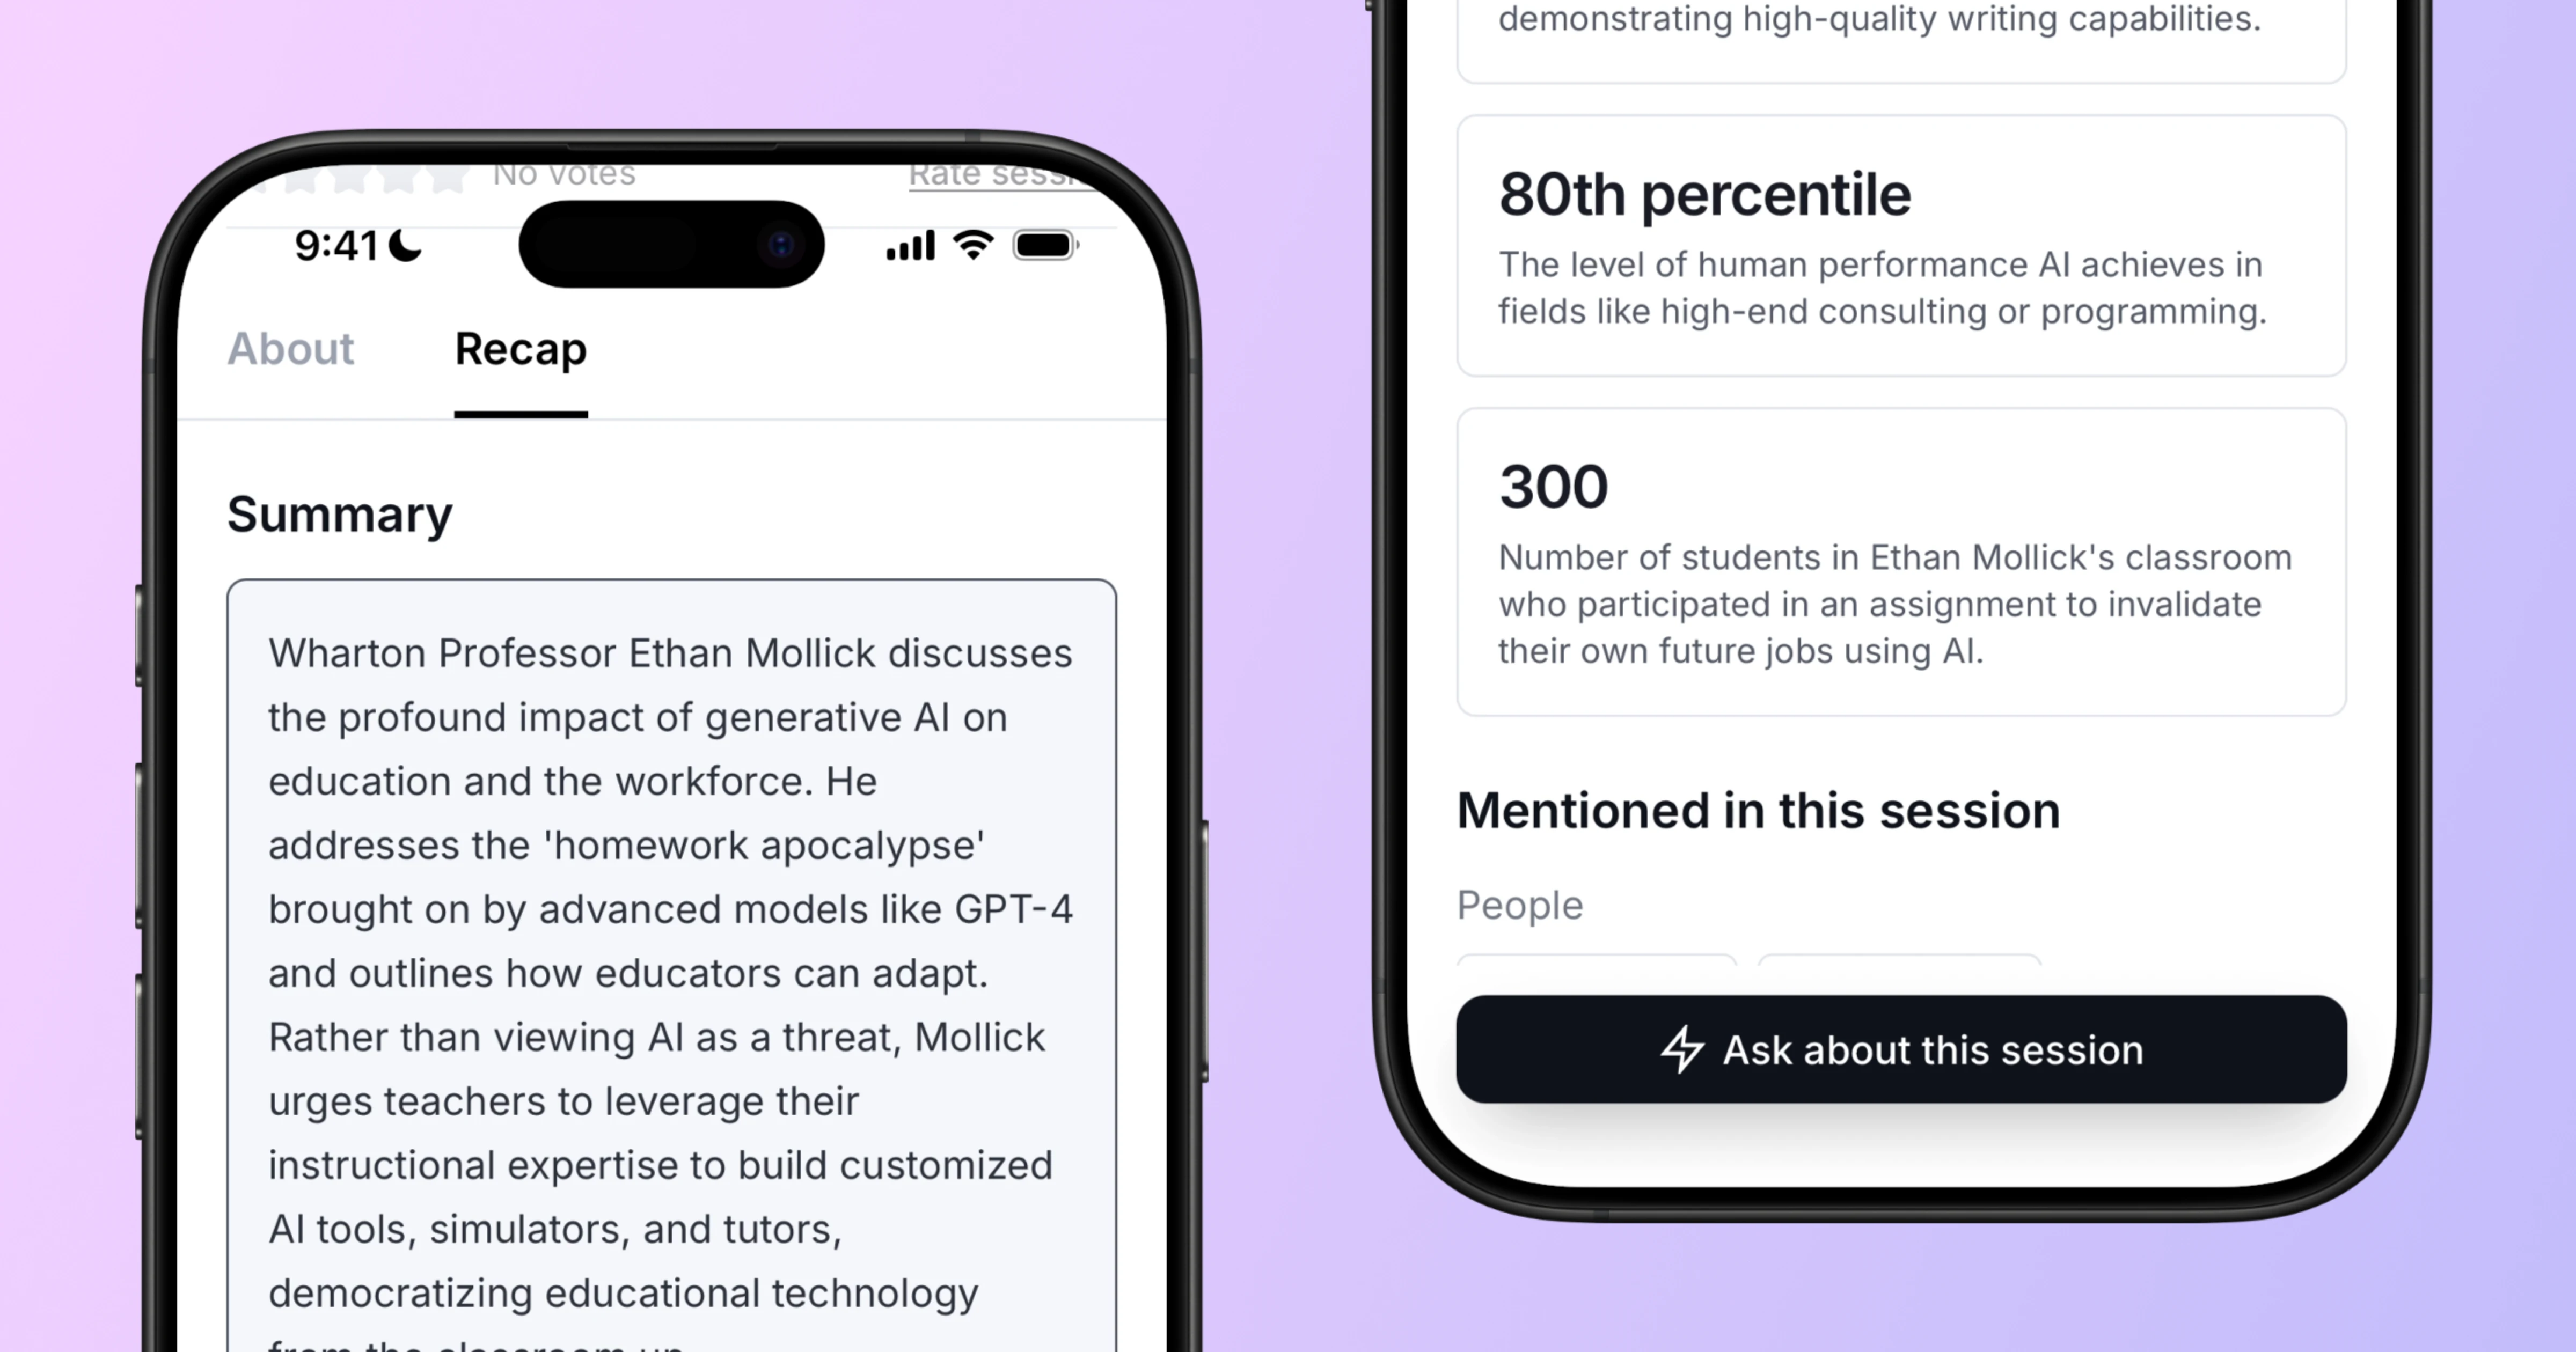
Chatbot Analytics
This one's underrated. See exactly what attendees are asking your event chatbot in real time. Unlike clicks on navigation links, these are attendees expressing their intent directly, telling you what they're confused about, what they want more of, what they're looking for. It's free signal you can act on immediately.

This is the foundation, not the finish line
We're calling this the MVP for a reason. The dashboards are solid, but we're updating them almost daily. If something's missing, could be visualized better, or you have a report you wish existed, tell us. We're building this in the open and your feedback shapes what comes next.